In 2017, Hudl finally achieved product-market fit in the high school volleyball market by launching a new visualization and reporting tool. I led the discovery and delivery of both the data-generation side and the presentational side.
My team's efforts unlocked millions of dollars of market for our high school and club business unit, and delighted our coaches and athletes with a new elite-level and highly-accurate volleyball visualization.
Hudl didn’t have product-market fit in the high school and club volleyball markets, but it wasn’t for lack of trying. I started by asking the uncomfortable question:
“Why have we failed so far?”

The first step was just understanding. I spoke to lots of folks involved with previous efforts. Other designers, product managers, sales, support, and more. I particularly liked this question—“Why have we failed?”—because it elicits such strong reactions out of people, either in affirmation (“Let me tell you why!”) or in negation (“I don’t think that’s quite right…”).
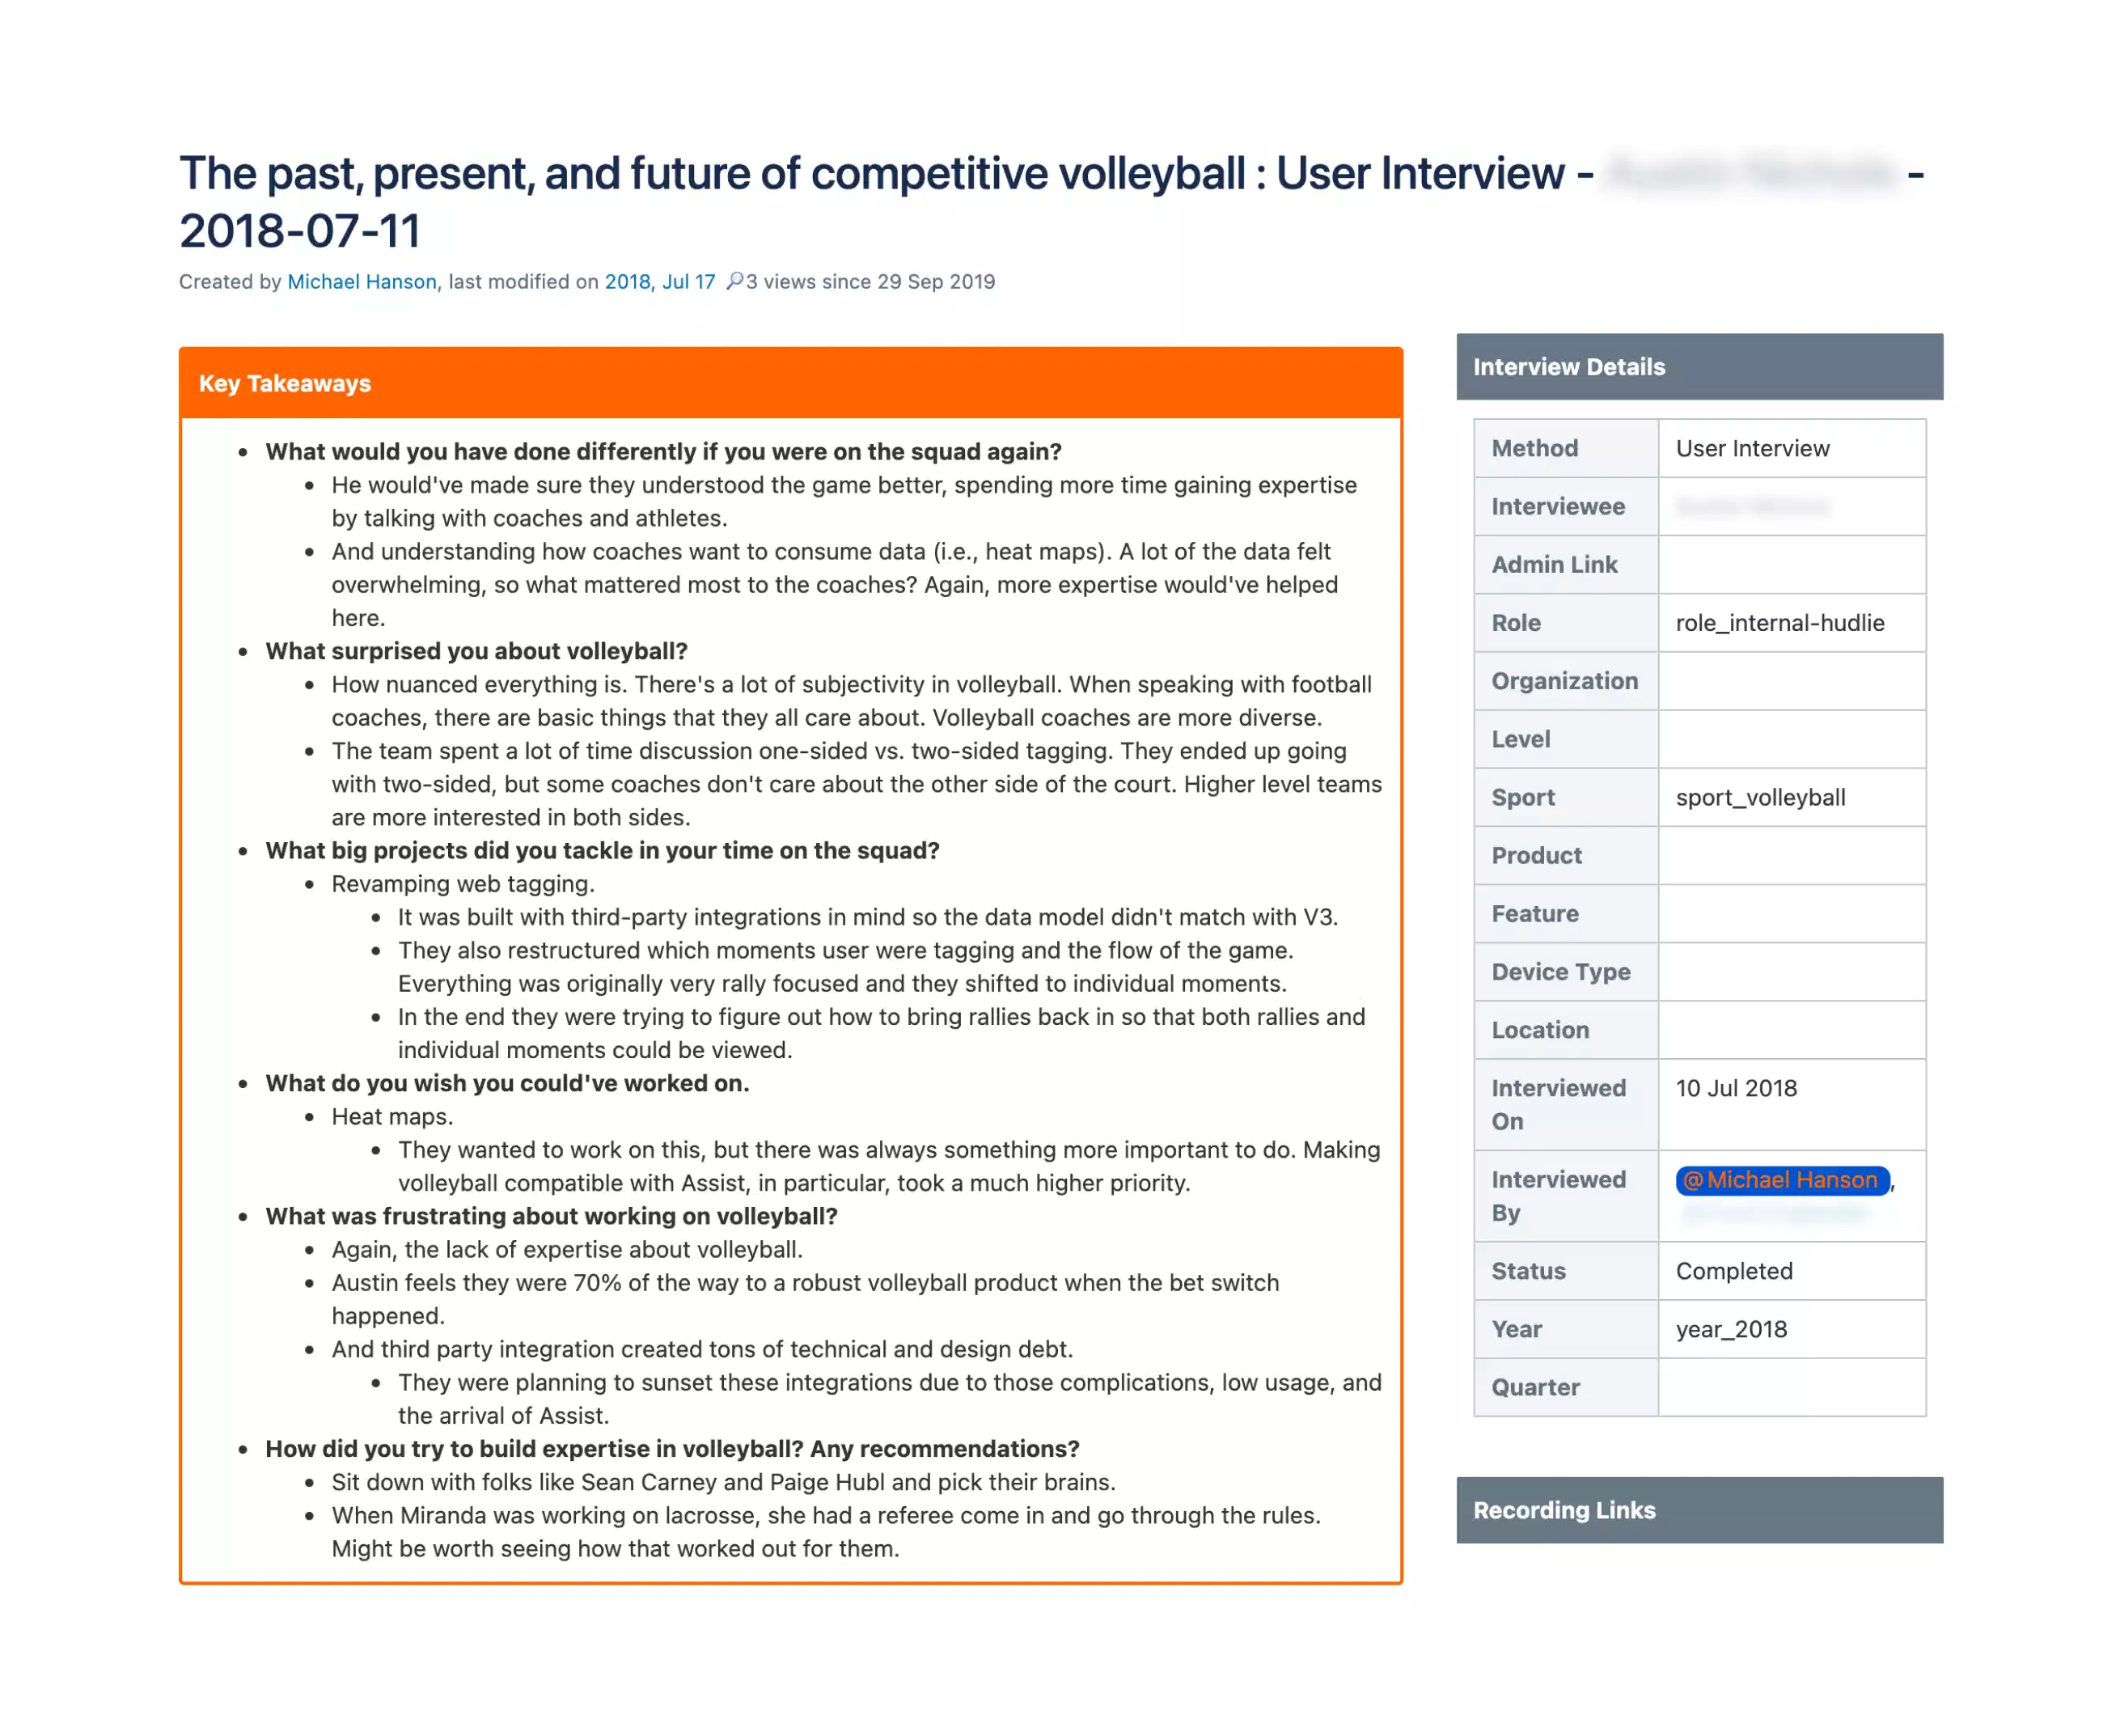
I also read every document I could find that told the story about our previous efforts and where other folks thought we should go next.
I learned a lot.
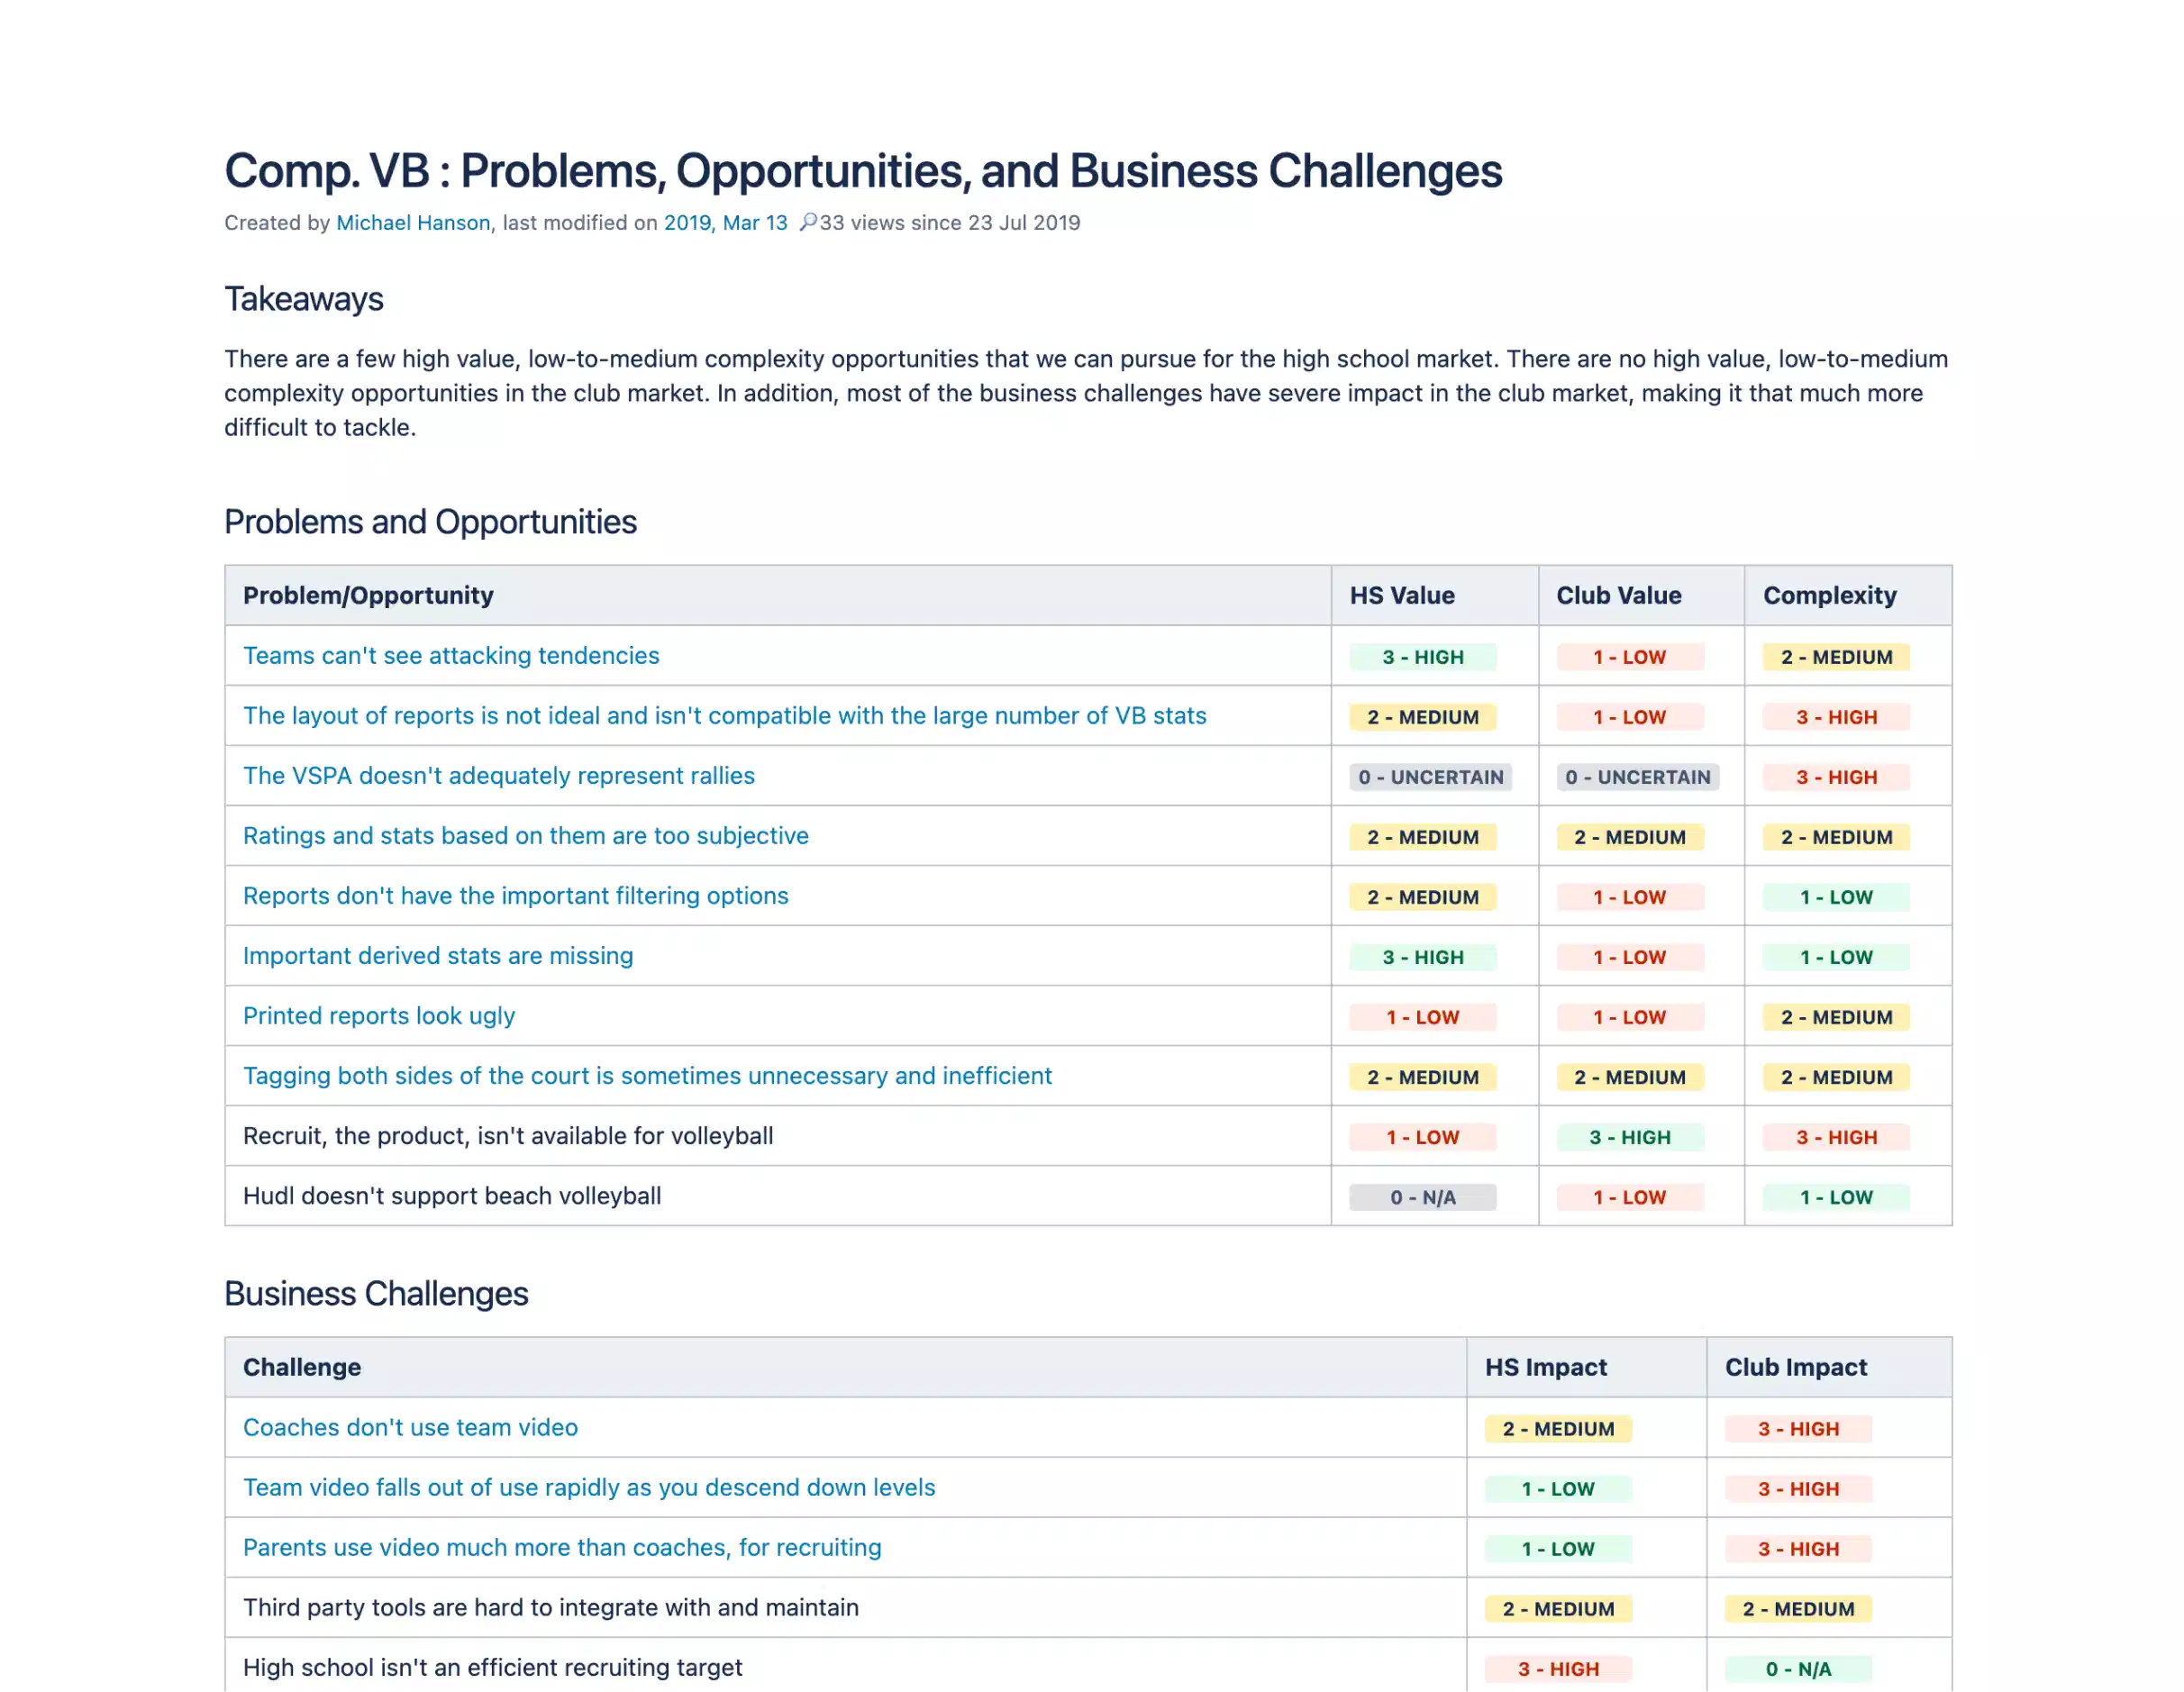
My interviews and research led me to several key problems and opportunities that might help us succeed, but one truly stood out.

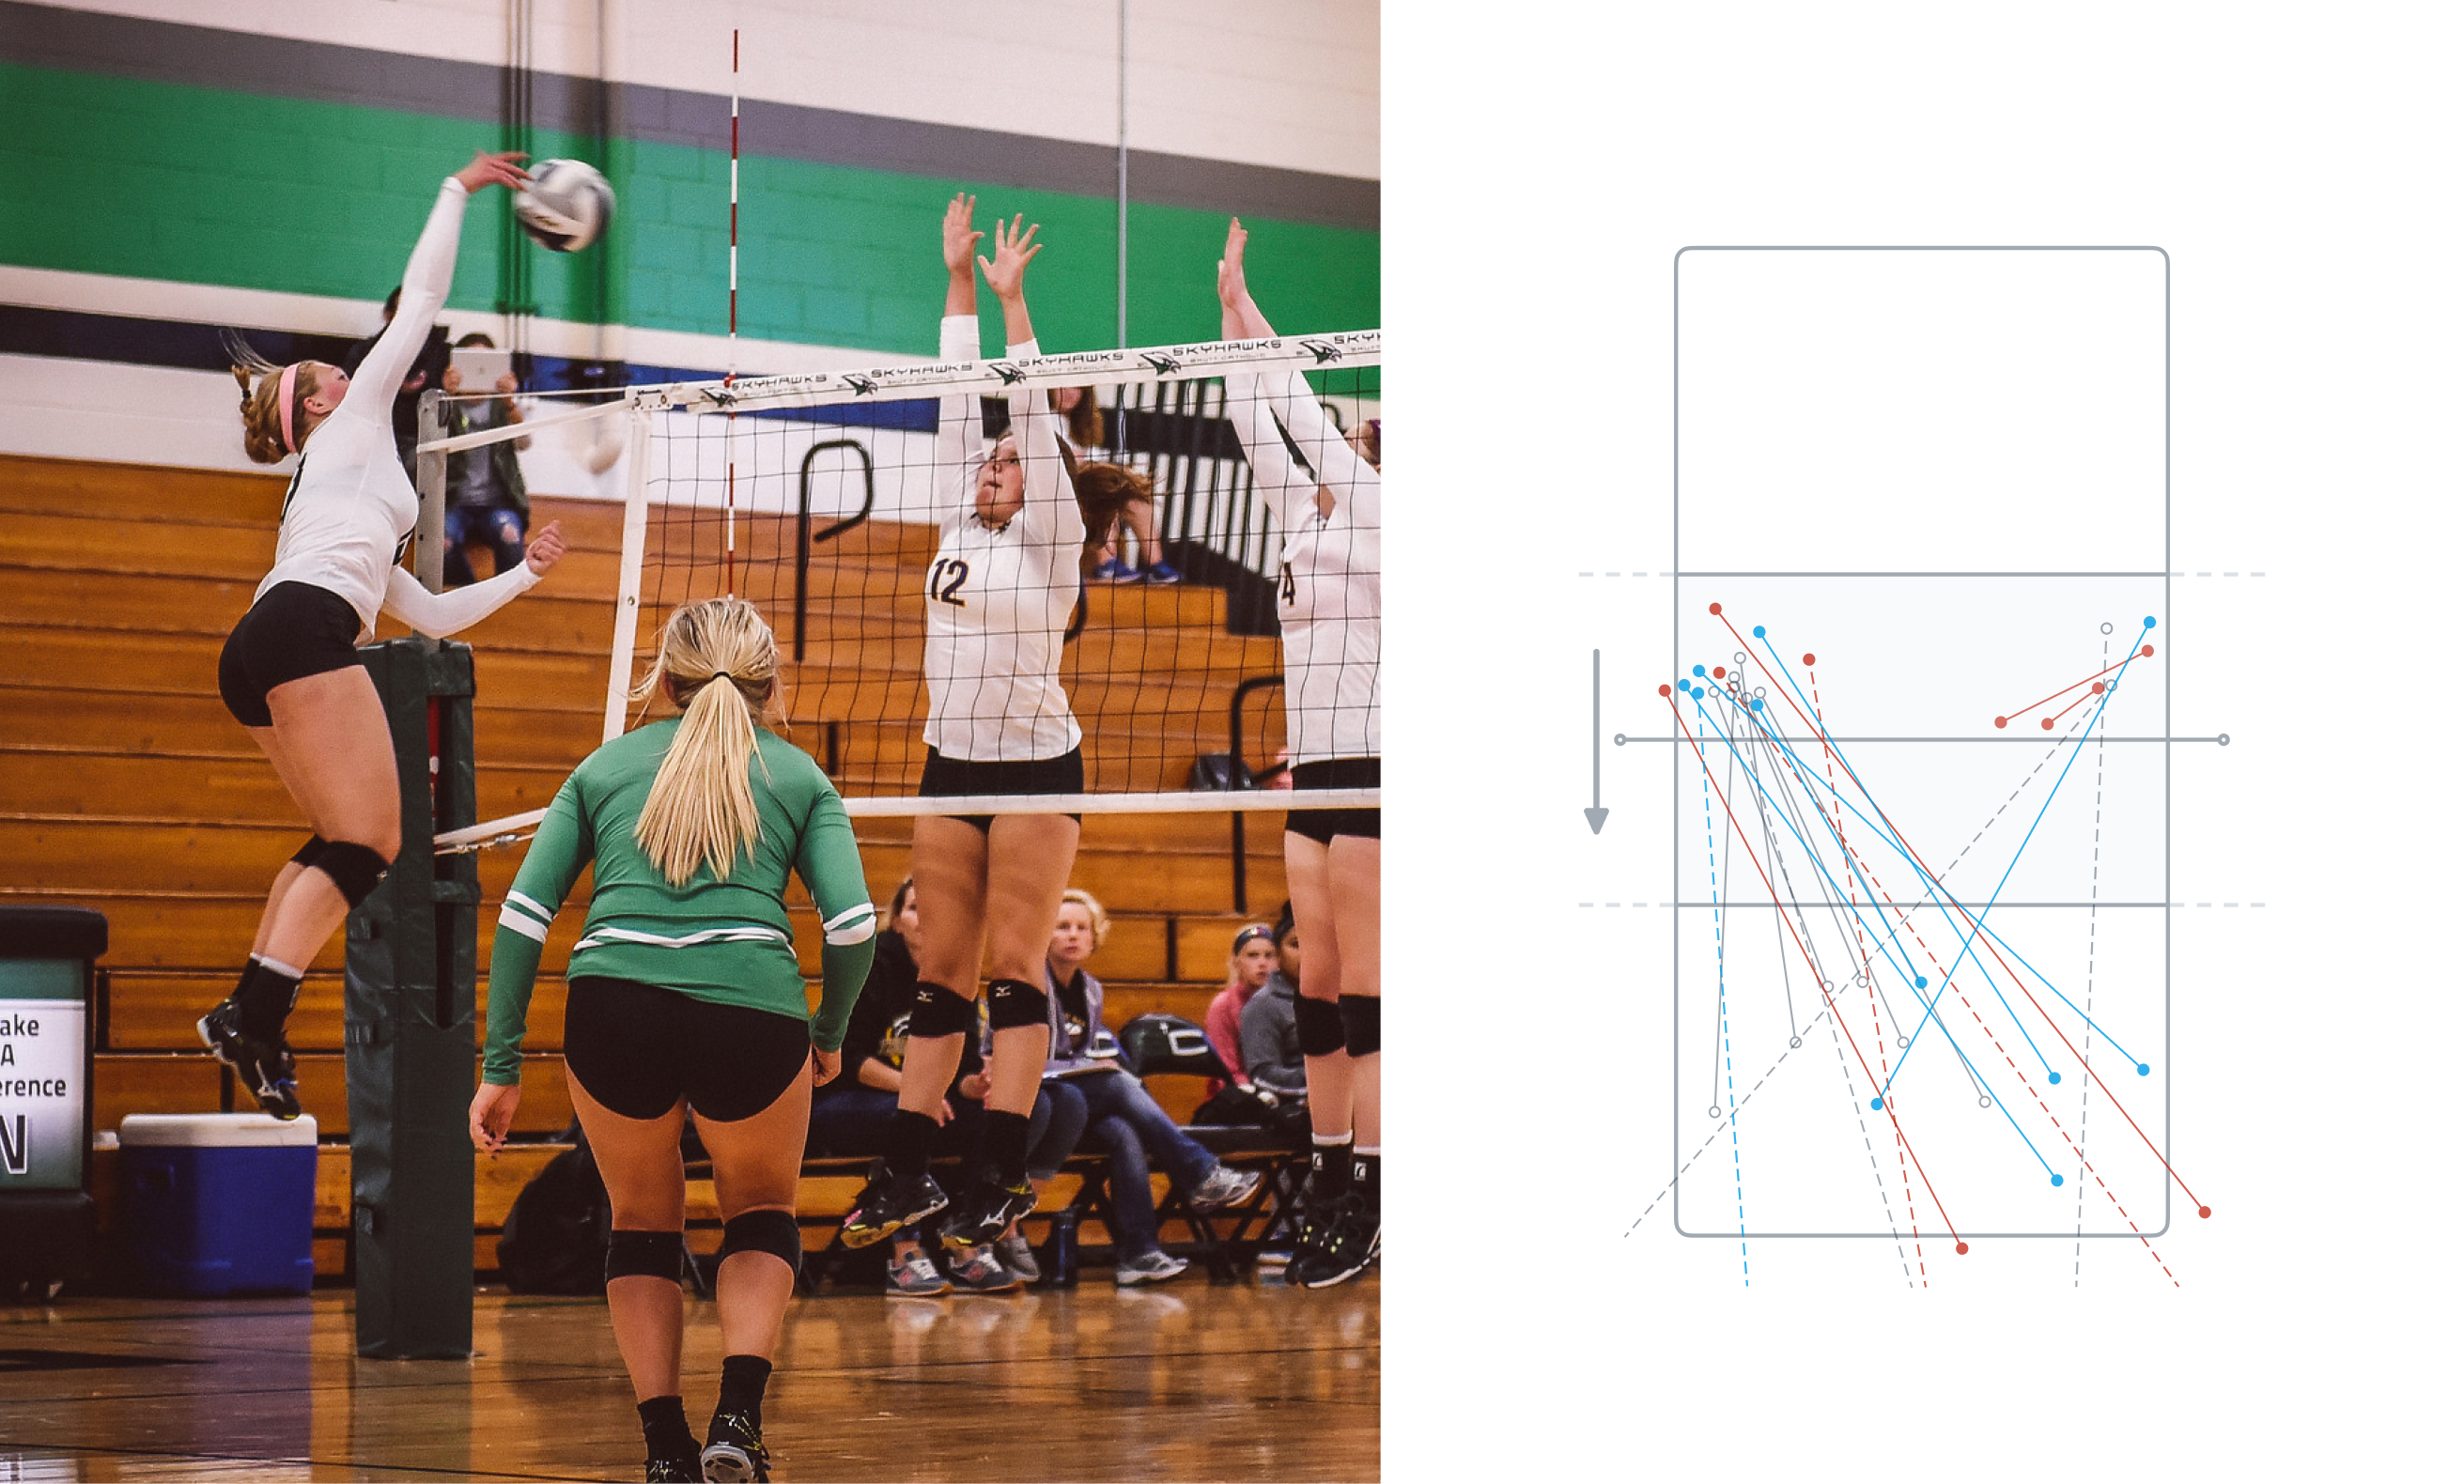
At the beginning of this project, I enrolled myself in a volleyball coaches' camp to learn more about the sport and interact with some coaches. One of the things I learned is that the structure of play is simple. Every play starts with a movement called a "dig" (saving the ball from touching the ground and giving the team a point), which is followed by a "set" (which moves the ball to a controlled location), which is then completed with an "attack" (in which the team in possession of the ball attempts to score a point).
If that attack doesn't score, then this sequence is repeated. And on and on it goes until someone scores.
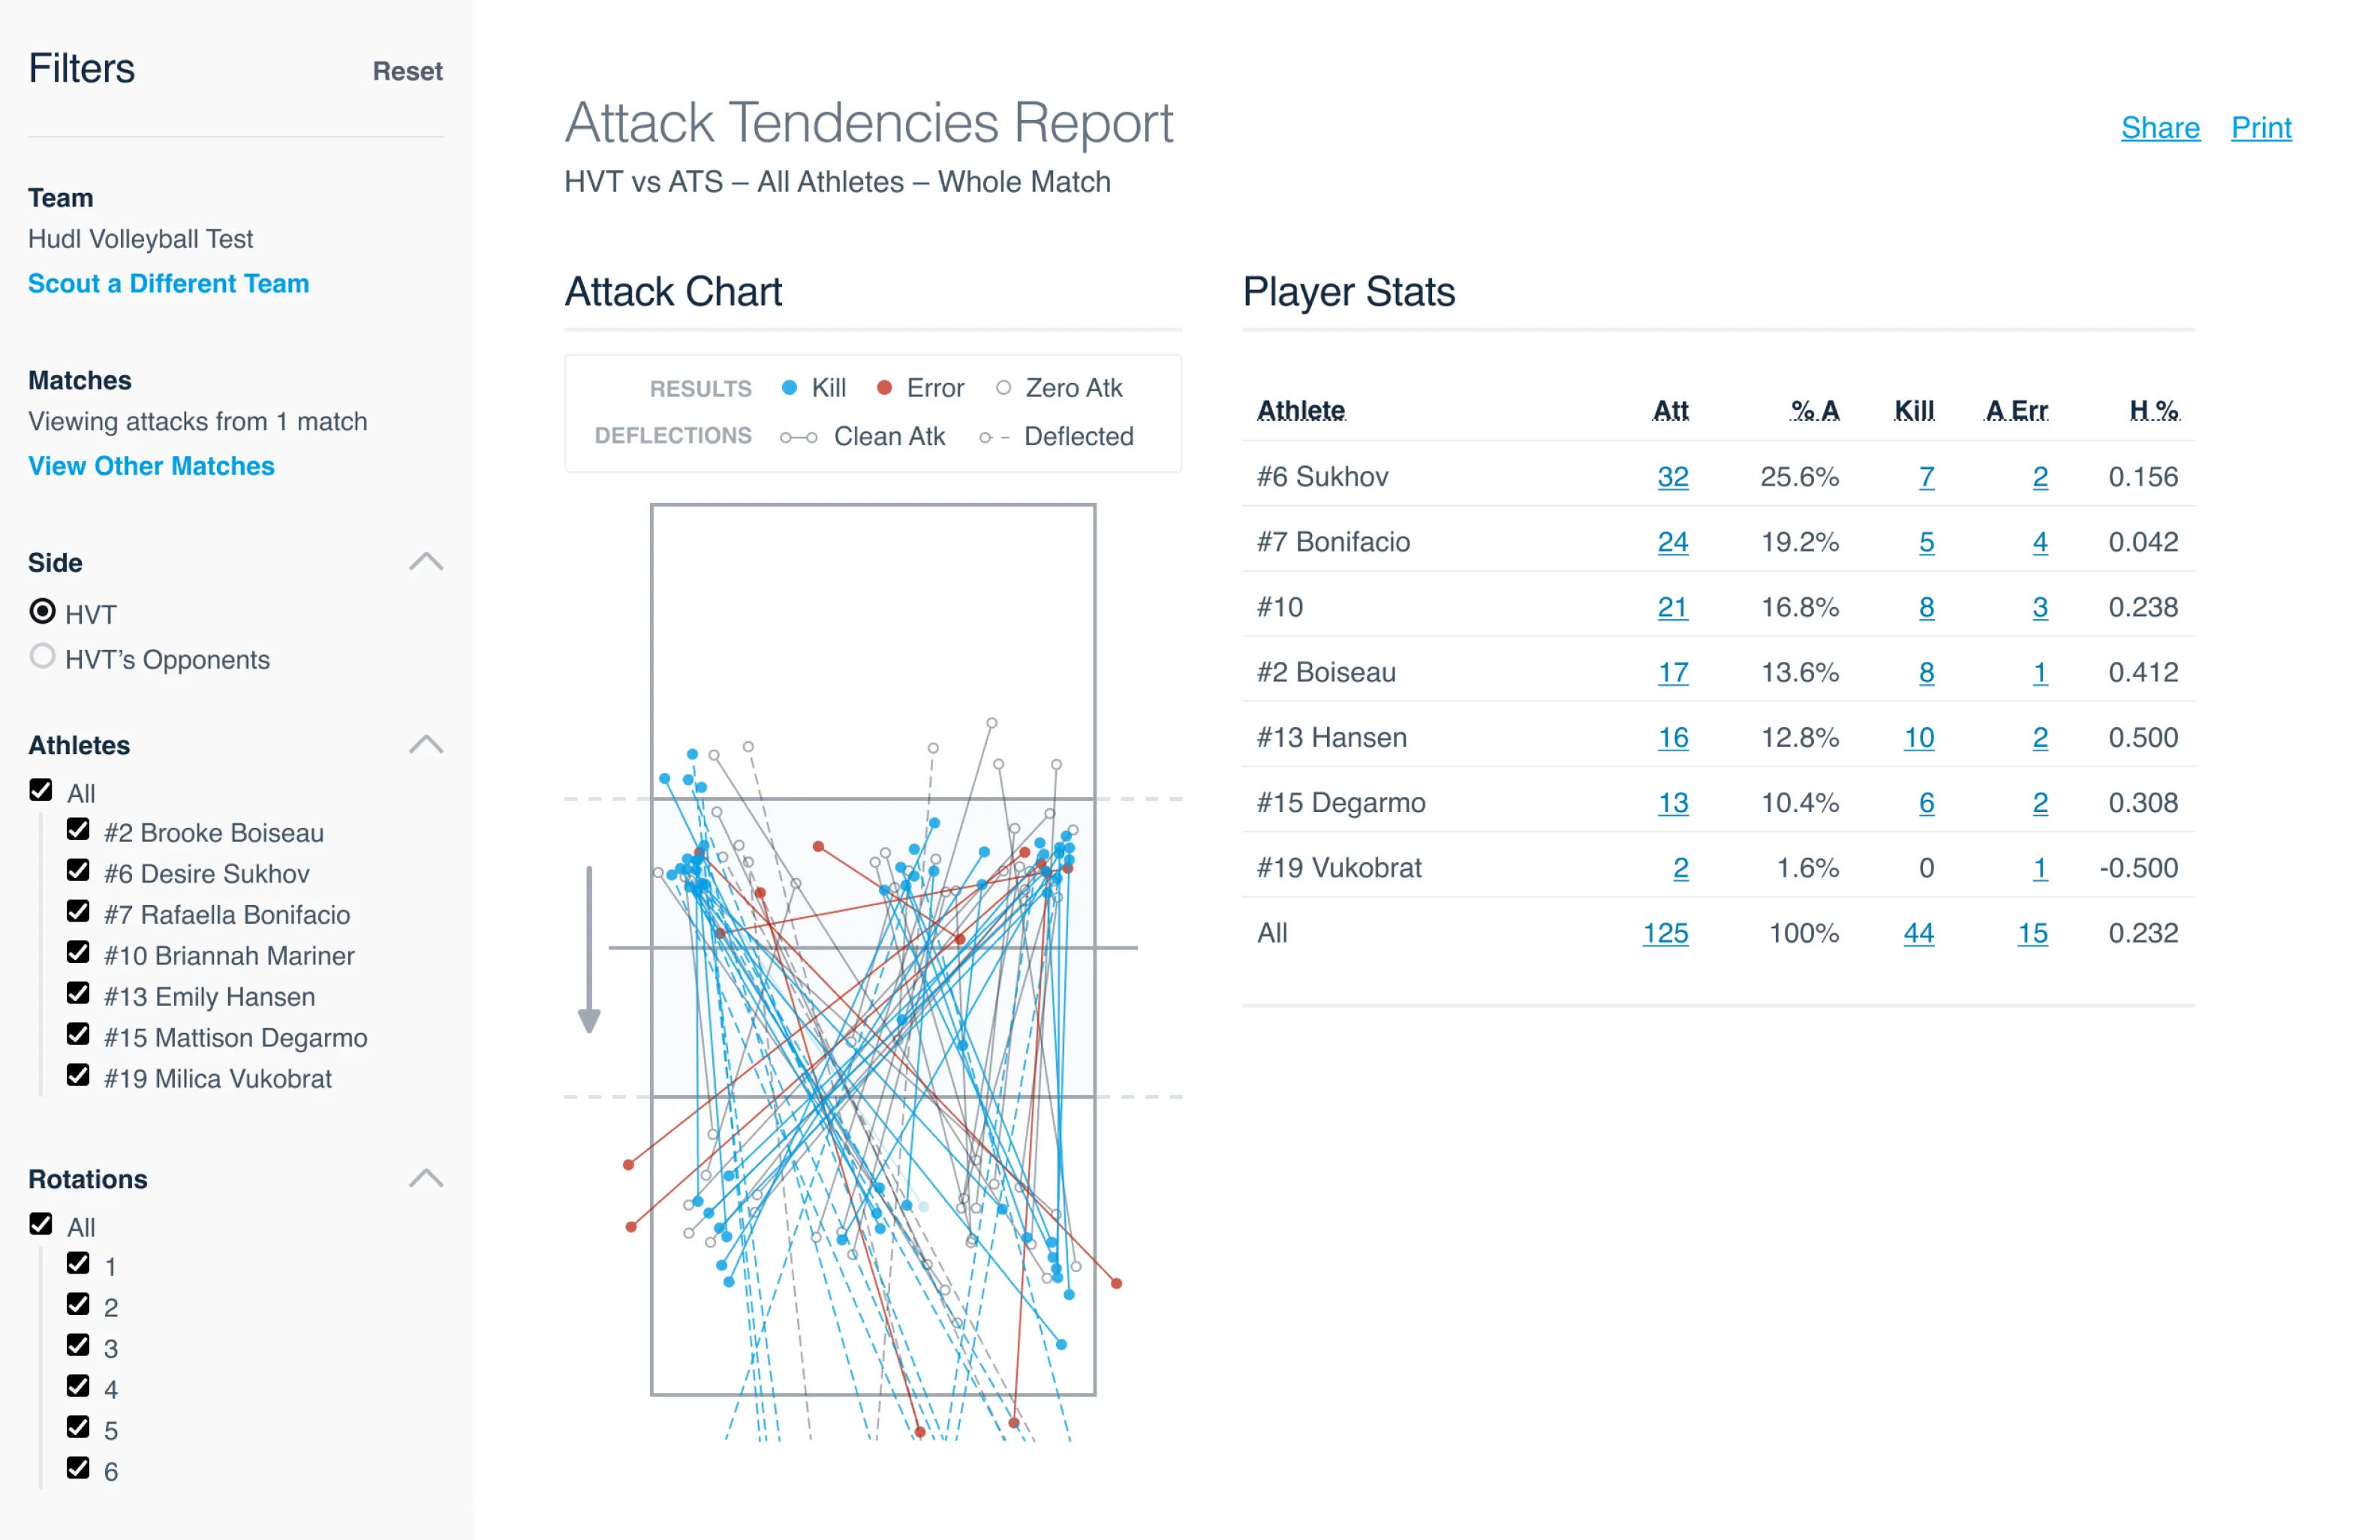
Understanding attacks is crucial. Where does our opponent attack from? Where do they attack to? Where are the most successful? What rotation is the team in when this is happening? We weren't helping our teams out with this, and it made it seem like we didn't care about them or their sport. We had to do better.
When we knew that we wanted to focus on Attack Tendencies, we then had two parallel tracks to chase down:
- Adding the data for attacks to every volleyball match.
- Giving our users a way to visualize the data.
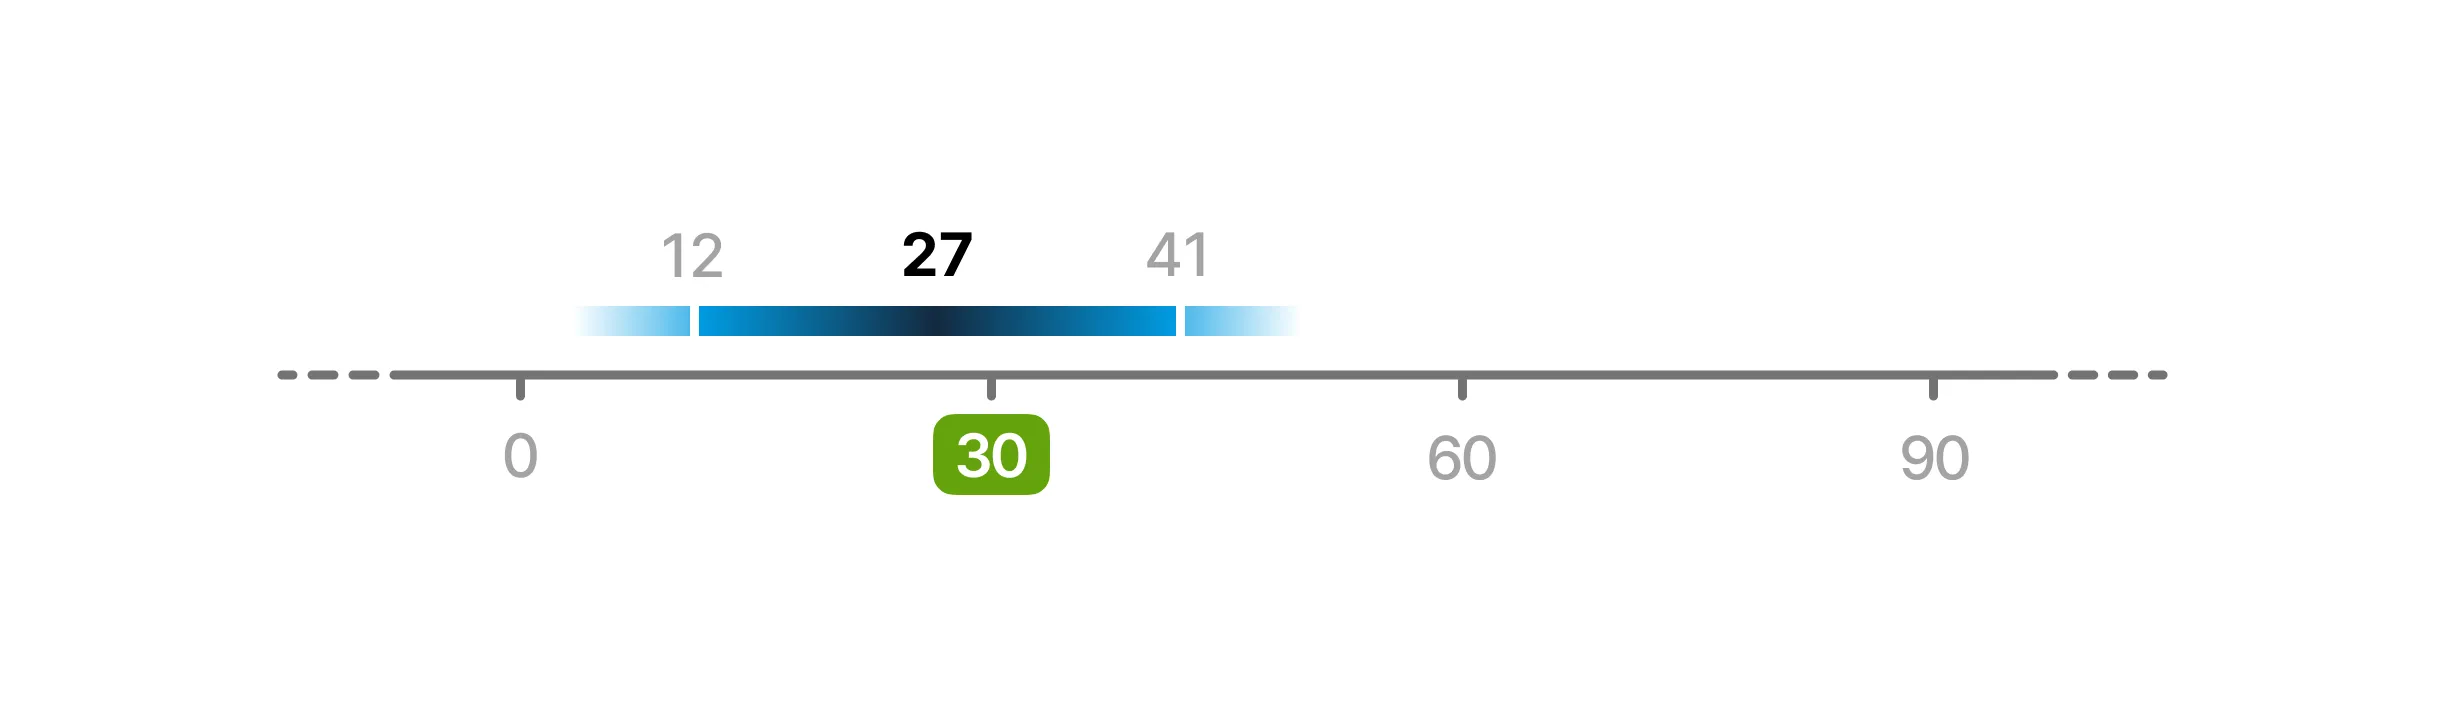
Working with stakeholders, we determined that we had 30 minutes of total budget to add to our data generation. If it took any longer, adding location data wouldn't be viable and we'd have to abandon the project.
With the volume of games we expected to analyze, every extra minute of time added to our data generation would mean a massive loss of profit. So in order to be as careful as possible, and to give our stakeholders as much confidence as possible, I taught myself inferential statistics.
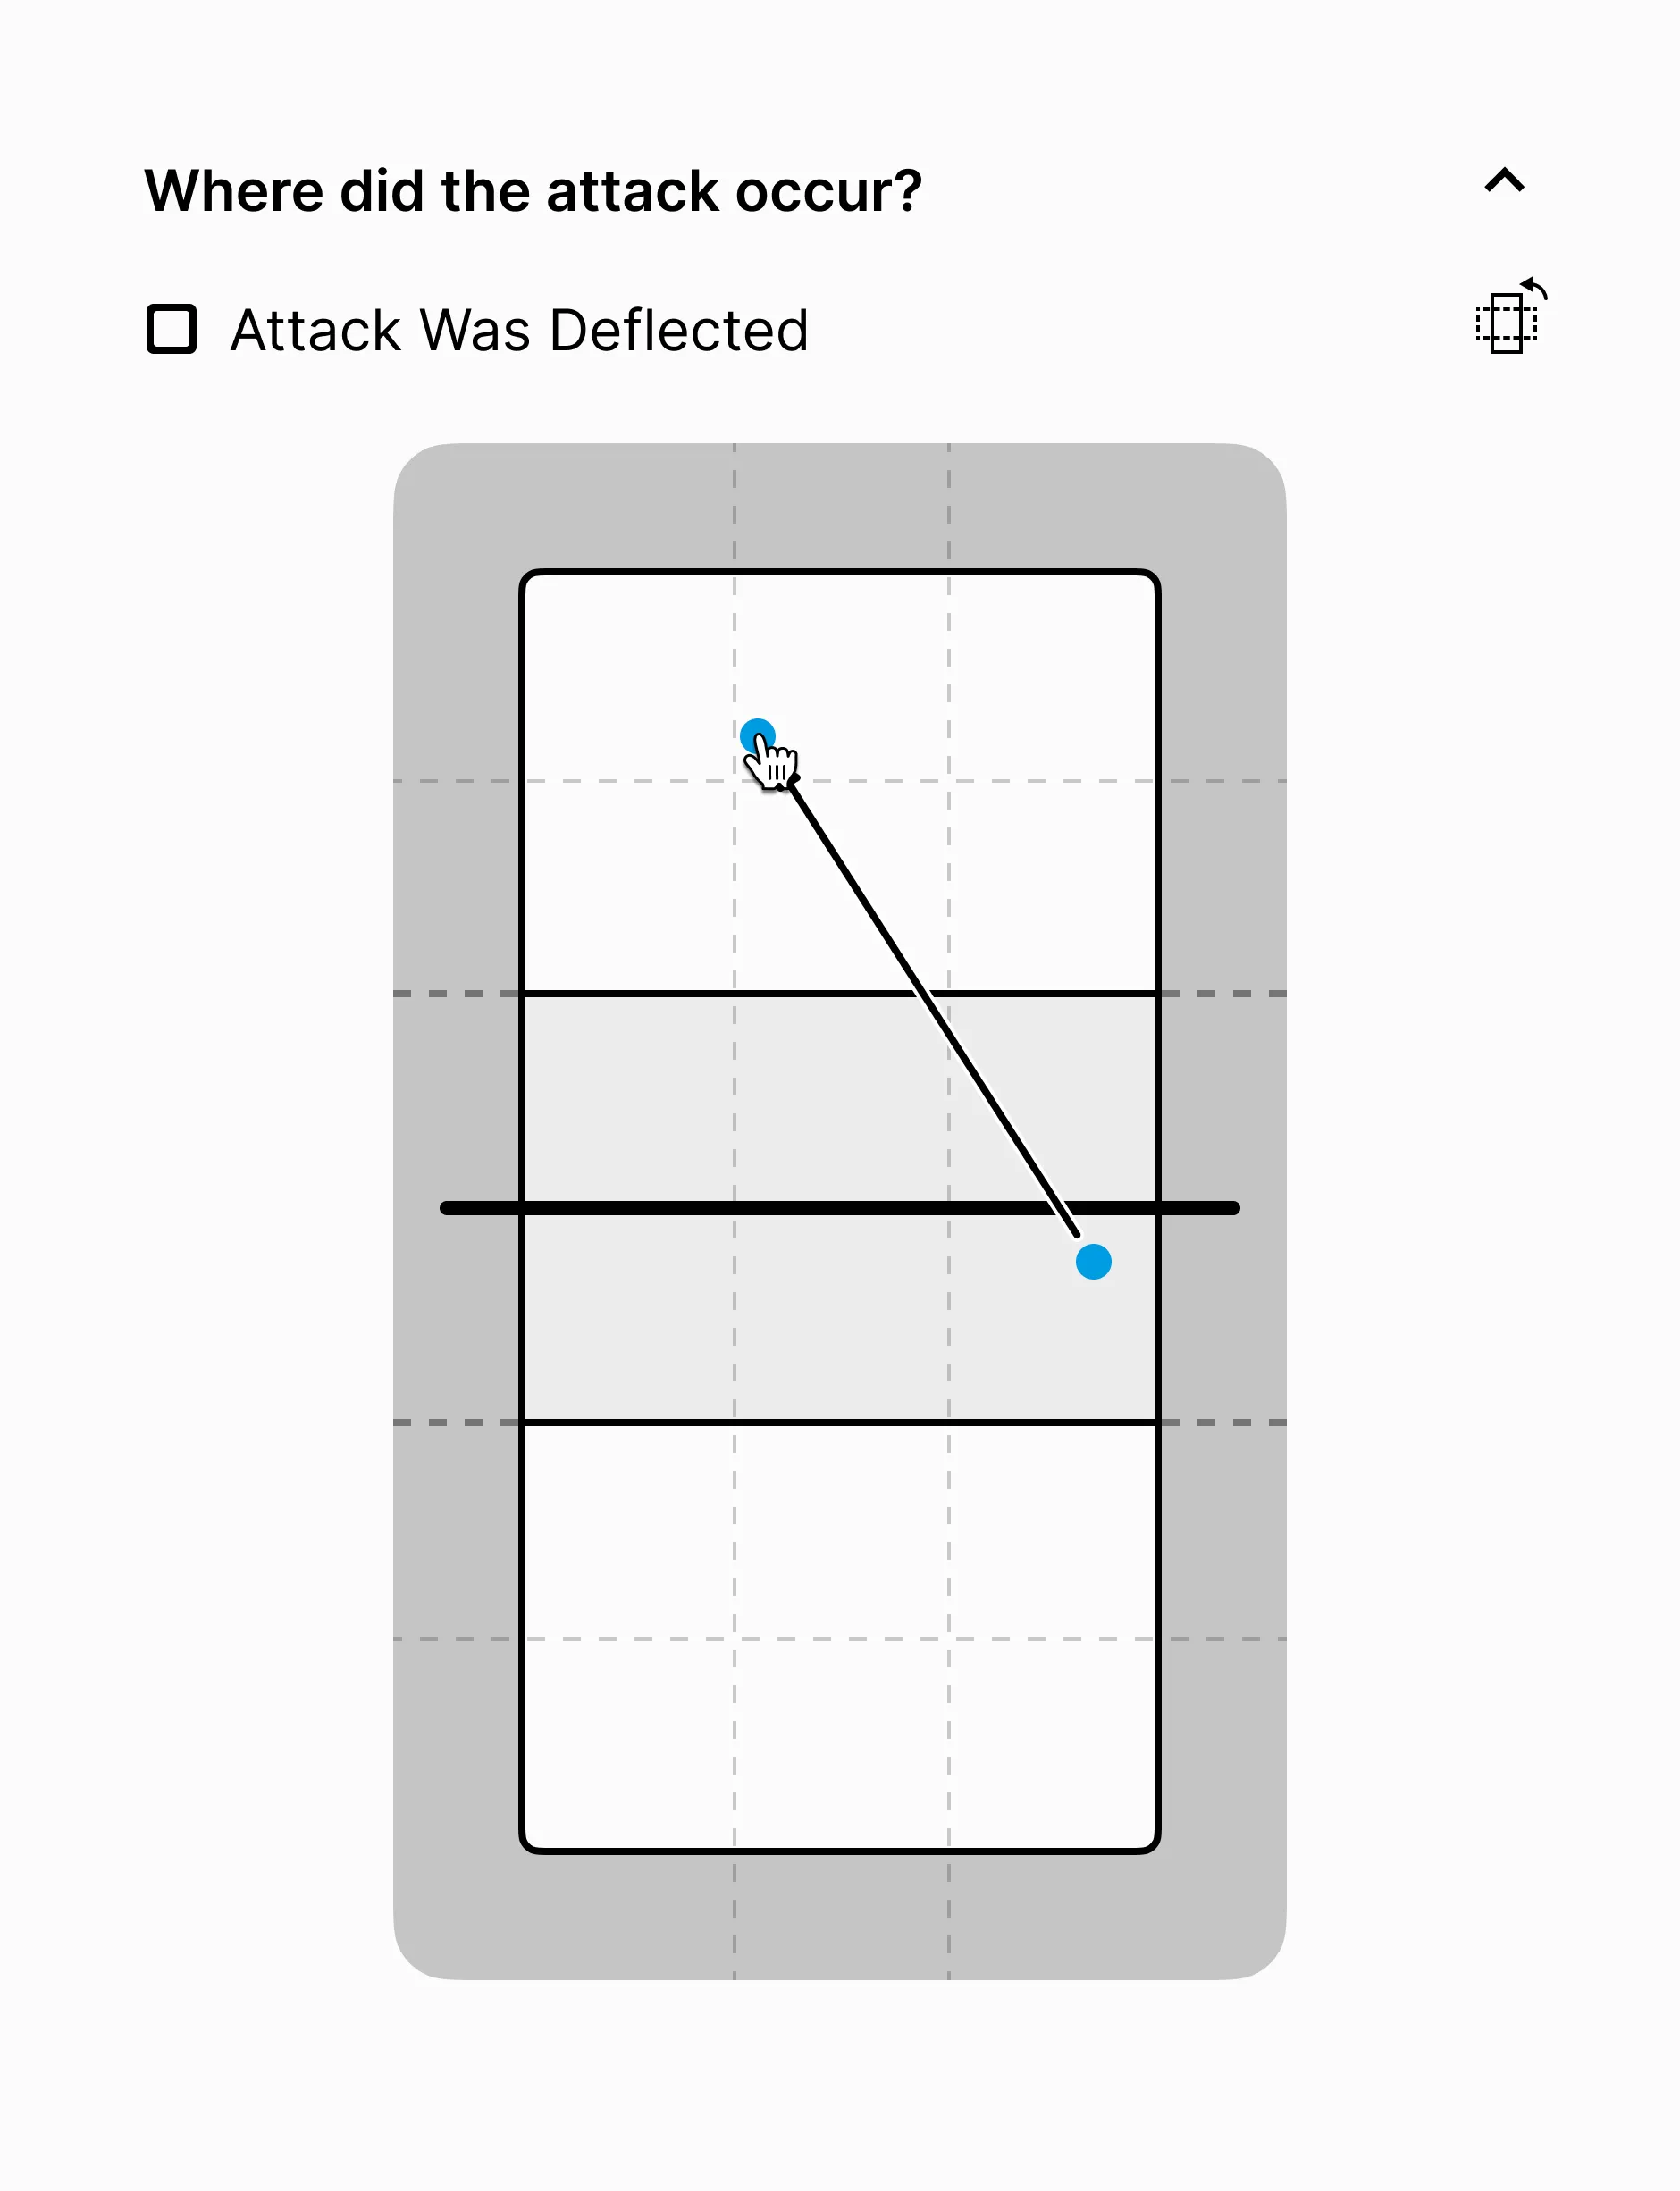
I worked with my engineering team to rapidly create a set of front-end prototypes to test various workflows and interactions.

After several rapid iterations, we were able to create a fast and ergonomic workflow for our analysts to add location data. And using robust statistical testing, we were able to prove that the increase in data generation would fit within our budget.
So what did we achieve?